Open University Malaysia
Faculty of Business and Management
BBPW3103
Financial Management 1
Name: Adam Khaleel
Lecturer: Abdul Munnim Mohamed Manik
Learning Centre: Villa College
Trimester: January 2012
Introduction to the companies’ background
Analyze of financial statements helps us to recognize a company’s strengths and weaknesses, which lead to good investment strategies and good financial planning. A large number of stakeholders will use and analyze financial statement information, particularly bankers, other lenders, suppliers, investors, and even some of the firm’s customers. For successful analysis and planning of financial statement require an understanding of a company’s external and internal environments.
This assignment includes the analysis and evaluation of profitability and leverage position of MALAYSIAN RESOURCES CORPORATION BERHAD and MITRAJAYA HOLDINGS BERHAD companies from Bursa Malaysia from the point of view of management, based on the financial statements for the years 2008, 2009 and 2010. These two companies are from construction sector of Malaysia. This analysis is based on leverage and profitability ratios of the financial statements of the companies. In addition to this, detailed profiles of these companies, explanation of profitability and leverage ratios with calculations and best performing company will be identified.
- MALAYSIAN RESOURCES CORPORATION BERHAD (MRCB)
According to About MRCB. (n.d), the Malaysian Resources Corporation Berhad (MRCB) is a property development and investment company from construction sector in Malaysia. This Group is one of the largest developers of residential, commercial and industrial properties in Malaysia. They have long-standing policy is to elevate quality and innovations with market needs as well as bringing quality living to all customers.
They started in 1969, under the name Perak Carbide Sdn. Bhd., as their core activity was the manufacturing of carbide. In 1981, they became known as MRCB, following a 360º shift in operational interests to property development and investment.
Today, MRCB is a fully-integrated, multi-discipline company with proven expertise in civil and infrastructure development. Following a policy of differentiation, MRCB has launched large-scaled projects in the northern, southern, eastern and central regions of Peninsular Malaysia, with similarly extensive ventures across East Malaysia.
Vision
In all our core businesses, we aim to produce world-class services to strengthen our corporate presence in strategic countries and markets. In so doing, we will dedicate all available resources for growth in the interest of our customers, employers, stakeholders and the various communities within our chosen countries of operations. Mission
We commit our focus and our resources towards quality development and delivery of services in each of the market and community we operate in, to ultimately help support their economic growth.
We pledge to continue building and sustaining a leading position in each of our core businesses, to subsequently enhance the quality of life through our projects and activities that are socially, culturally and environmentally responsible.
We promise to create shareholder value and uphold the principles of good corporate governance, integrity and honesty.
We undertake the task of nurturing a corporate culture that emphasises on the pursuit of excellence by enabling our assets: our employees. We vow to provide for employee-training, career development and active sharing of knowledge and skills to underscore the value we place on them.
- MITRAJAYA HOLDINGS BERHAD (MHB)
According to Our business portfolio. (n.d), This Company is also from construction sector in Malaysia. Mitrajaya Holdings Bhd through its principal subsidiary, Pembinaan Mitrajaya Sdn Bhd, has created for itself an enviable track record of successful projects in construction and civil engineering related fields. Mitrajaya has long been a major player in helping Malaysia become a nation with modern infrastructure, as well as providing quality living and working environments. They have played a significant role in major national projects such as the Kuala Lumpur International Airport projects.
The construction division has grown in tandem with the great infrastructural transformation Malaysia has undergone in a short period of time. This process includes the rapid building of the country's major hubs of transportation, commerce and finance. Concurrently, in collaboration with international consultants, the Division has undertaken the completion of hotels, resorts, power plants, highways and golf courses of world renown. They are now a multi-national conglomerate with businesses in a diverse range of industries, among them, construction, property development, international projects, manufacturing as well as healthcare.
Mission
Mitrajaya's mission is to provide timely and quality services to all its customers by
• Exercising due care to the environment.
• Upholding best business ethics
• Meeting its social obligations
• Meeting employee expectations and
• Optimizing shareholder value
Vision
To be the preferred product and service provider in all our core businesses.
Description of Categories of ratios
According to Dr. Ibrahim, Y., Abidin, F, Z., Manab, N, A., Ismail, R., Zainuddin, Z. (2010, p.19-78), Ratio analysis refers to methods of calculating and interpreting financial ratios to assess a firm’s performance. It provides details for financial planning, puts details into perspective and manages expectations of creditors and investors. Financial information can be compared using three bases of within the company, between companies and industry average. There are three techniques of analysis of horizontal, vertical and ratio analysis. Ratio analysis is done within the company, between the companies and an industry average. Financial ratios are classified in to four areas; liquidity, efficiency, profitability and debt management.
Profitability ratio:
It measures the ability of the business to generate profit within a specified period. It is used as an indicator to analyze the efficiency and effectiveness level of the business in achieving its profit objective. The profitability ratios are:
- Gross Profit Margin =gross profit ÷ net sales × 100
It is used to measure the profit of sales that can be used to pay for the sales and administrative expenses. The result is in percentage and the higher this percentage is better.
- Net profit margin = net profit ÷ net sales × 100
It is used to measure the capability of the company to generate gross profit from every Ringgit of sales. The result is in percentage and the higher this percentage is better.
- Operating Profit Margin = Operating Profit ÷ Sales × 100
The operating profit margin measures the efficiency of operations in reducing costs and increasing returns before interest and tax. A higher operating profit margin is better.
- Return on Asset = Profit after tax ÷ Total Asset × 100
The Return on assets or return on investment measures the effectiveness of the company in using its assets to generate profit and the higher the ratio, the better the status of the company.
- Return on Equity = Profit after tax ÷ Shareholders' Equity × 100
The Return on equity measures the efficiency of the company in generating profit for its ordinary shareholders and the higher the ratio, the better.
- Earnings per share = Profit available to ordinary shareholders ÷ Number of ordinary shares
The Earnings per share calculate the net profit that is generated from each ordinary share and the bigger the value of this ratio, the better the status of the shareholders.
Leverage Ratio:
It measures the ability of the business to continue its operation. The ratios are:
- Interest cover ratio = Profit before interest and tax ÷ interest expenses
It is used to measure the capability of business to pay interest of the current year from the profit of current year. The result is in times and the higher the ratio, the better.
- Debt ratio = total liability ÷ total asset × 100
It is used to measure the percentage of total asset financed by creditors. The result is in percentage and the higher the debt ratio, the lower the equity ratio.
- Equity multiplier = Total asset ÷ Total equity × 100
Equity multiplier shows the asset ownership for each ringgit of equity. Debt ratio and equity multiplier provides the same information but in different approach. Debt ratio of 40% means that the company is being funded by 40% debts. Based on the balance sheet identity: Asset = Liability + Equity
- Debt-equity ratio = Long - term liabilities ÷ Shareholders equity × 100
The Debt equity ratio measures the total long-term debts for each ringgit of equity. The lower the ratio, the better it is because it shows that the total equity owned by the company exceeds the long-term debts.
Summary of calculations of profitability and leverage ratios
According to the annual reports of MRCB and MHB companies. (2010, 2009, 2008),
PROFITABILITY AND LEVERAGE RATIO CALCULATIONS
| ||||||
RATIO AND FORMULA
|
MALAYSIAN RESOURCES CORPORATION BERHAD
|
MITRAJAYA HOLDINGS BERHAD
| ||||
Profitability Ratios
|
2010
|
2009
|
2008
|
2010
|
2009
|
2008
|
Gross profit margin=Gross profit/Sales*100
|
17.60%
|
13.10%
|
9.40%
|
100%
|
100%
|
100%
|
Net profit margin=profit after tax/Sales*100
|
11.40%
|
6.10%
|
11.10%
|
101.20%
|
101%
|
93.30%
|
Operating profit margin=operating profit/Sales*100
|
20.90%
|
15.20%
|
15.30%
|
111.60%
|
103.30%
|
107.70%
|
Return on assets=profit after tax/total asset*100
|
1.70%
|
1.70%
|
3.10%
|
3.80%
|
13%
|
2.50%
|
Return on equity=profit after tax/shareholders equity*100
|
3.10%
|
4.20%
|
7.60%
|
4.50%
|
15.20%
|
2.80%
|
Earnings per share=profit available to ordinary shareholders/no. of ordinary shares issued
|
3.04 (Sen)
|
3.27 (Sen)
|
5.60 (Sen)
|
7.30 (Sen)
|
24.71 (Sen)
|
2.92 (Sen)
|
Leverage Ratios
|
2010
|
2009
|
2008
|
2010
|
2009
|
2008
|
Debt ratio=total liabilities/total assets*100
|
45.10%
|
58.90%
|
59.10%
|
15.90%
|
14.60%
|
10.10%
|
Debt-equity ratio=long-term liability/shareholders equity*100
|
40.00%
|
71.80%
|
0.45%
|
0%
|
0.75%
|
6.30%
|
Equity Multiplier=total asset/total equity
|
1.8 times
|
2.4 times
|
2.4 times
|
1.2 times
|
1.2 times
|
1.1 times
|
Interest coverage ratio=profit before interest and tax/ interest expense
|
3.1 times
|
2.3 times
|
4.1 times
|
220 times
|
55.8 times
|
3.7 times
|
Analysis of the profitability and leverage ratios
Profitability ratios; According to the annual reports of MRCB and MHB companies. (2010, 2009, 2008),
- Gross profit margin: It is the profit on sales. If it is higher, the better for the company. The calculations of ratios from above table shows that the gross profit percentage for Malaysian Resources Corporation Berhad continuously increased from 9.40% in 2008, 13.10% in 2009 to 17.60% in 2010 but the gross profit margin for Mitrajaya Holdings Berhad remained constant at 100% in these three years.
- Net profit margin: It is the profit on sales after deducting the overhead expenses. If it is higher, the better. The table shows that net profit margin for Malaysian Resources Corporation Berhad improved from 11.10% to 11.40% from the year 2008 to 2010 but it decreased to 6.10% in 2009. Whereas for Mitrajaya Holdings Berhad there was increasing trend from 93.30% in 2008, 101% in 2009 and to 101.20% in 2010.
- Operating Profit Margin: The operating profit margin measures the efficiency of operations in reducing costs and increasing returns before interest and tax. A higher operating profit margin is better. The table shows that operating profit margin for Malaysian Resources Corporation Berhad improved from 15.3% to 20.9% from the year 2008 to 2010 but it decreased to 15.2% in 2009. At a same time it increased from 107.7% to 111.6% from 2008 to 2010 but it decreased to 103.3% in 2009 for Mitrajaya Holdings Berhad.
- Return on assets: It is the profit on assets-if it is higher the better. The table shows that return on assets decreased from 3.1% to 1.7% from 2008 to 2009 and remained constant at 1.7% in 2010 for Malaysian Resources Corporation Berhad. Whereas for Mitrajaya Holdings Berhad it increased from 2.5% to 13% from 2008 to 2009 but it decreased to 3.8% in 2010.
- Return on equity: if it is higher the better. The table shows the return on equity for Malaysian Resources Corporation Berhad decreased from 7.6% to 3.1% from 2008 to 2010 and it was 4.2% in 2009 but it increased from 2.8% to 15.2% from 2008 to 2009 and decreased to 4.5% in 2010 for Mitrajaya Holdings Berhad.
- Earnings per share: It is the profit generated for each ordinary share. If it is higher the better. The table shows the earning per share continuously decreasing from 5.60 (Sen) in 2008, 3.27 (Sen) in 2009 to 3.04 (Sen) in 2010 for Malaysian Resources Corporation Berhad. Meantime for Mitrajaya Holdings Berhad it increased from 2.92 (Sen) in 2008 to 24.71 (Sen) in 2009 but it decreased in 2010 to 7.30 (Sen).
Leverage ratios; According to the annual reports of MRCB and MHB companies. (2010, 2009, 2008),
- Debt ratio: It calculates the total assets financed by creditors. Owners prefer higher debt ratio as funds financed by loans can generate higher returns. The table shows the debt ratio for Malaysian Resources Corporation Berhad continuously decreasing from 59.1% in 2008, 58.9% in 2009 to 45.1% in 2010. At a same time it shows continuous increasing from 10.1% in 2008, 14.6% in 2009 to 15.9% in 2010 for Mitrajaya Holdings Berhad.
- Debt-equity ratio: The Debt equity ratio measures the total long-term debts for each ringgit of equity. The lower the ratio, the better it is because it shows that the total equity owned by the company exceeds the long-term debts. The table shows the debt-equity ratio for Malaysian Resources Corporation Berhad increased from 0.45% in 2008 to 71.8% in 2009 but it decreased in 2010 to 40% by showing unusual change. Meanwhile it continuously decreased from 6.3% in 2008, 0.75% in 2009 to 0% in 2010 for Mitrajaya Holdings Berhad.
- Equity multiplier: Equity multiplier shows the asset ownership for each ringgit of equity. Debt ratio and equity multiplier provides the same information but in different approach. The table shows the equity multiplier for Malaysian Resources Corporation Berhad remained constant at 2.4 times in 2008 and 2009 but it decreased to 1.8 times in 2010. Whereas for Mitrajaya Holdings Berhad it increased from 1.1 times in 2008 to 1.2 times in 2009 and remained constant at 1.2 times in 2010.
- Interest cover ratio: It is used to measure the capability of business to pay interest of the current year from the profit of current year. The result is in times and the higher the ratio, the better. The table shows the interest cover ratio for Malaysian Resources Corporation Berhad decreased from 4.1 times in 2008 to 2.3 times in 2009 and increased to 3.1 times in 2010. Meanwhile for Mitrajaya Holdings Berhad it continuously increased from 3.7 times in 2008, 55.8 times in 2009 to 220 times in 2010 by showing unusual change.
Evaluation of the relationship between financial leverage and profitability
Profitability ratios; According to the annual reports of MRCB and MHB companies. (2010, 2009, 2008),
Gross profit margin: It shows the balance percentage for each ringgit of sales after the company had paid all the costs of goods. The reason for increasing the gross profit margin for Malaysian Resources Corporation Berhad was due to decreasing the cost of sales in every year and increasing the revenue in 2009. The higher the gross profit margin, the better the status of the company as this shows lower expenditures or costs involved in implementing sales activities and better purchasing management of the company. The gross profit margin for Mitrajaya Holdings Berhad remained constant because there were no cost of sales and revenue were the gross profit of the company in these three years. The reason for there was no cost of sales because the company does not involve in purchasing management but the group was doing the purchasing for them. Hence the total revenue is equal to the gross profit of the company. The gross profit margin was better for Mitrajaya Holdings Berhad than Malaysian Resources Corporation Berhad.
Net profit margin: it shows the ability of the company to generate net profit from each ringgit of sale after deducting all expenditure. The higher the net profit margin, the better the status of the company as this shows an efficient purchasing management with low purchasing costs. There is an improvement in net profit margin for Malaysian Resources Corporation Berhad in first two years due to decreasing the expense and increasing the incomes but it decreased in 2010 due to increasing expenditure of the company. There is a continuous increasing net profit margin for Mitrajaya Holdings Berhad due to decreasing the expense and increasing the incomes. Hence the Mitrajaya Holdings Berhad managed the expenditure more effectively than Malaysian Resources Corporation Berhad.
Operating Profit Margin: The operating profit margin measures the efficiency of operations in reducing costs and increasing returns before interest and tax. A higher operating profit margin is better as it indicates that the company is able to operate efficiently. Although there is slight decreasing the operating profit margin in second year for both companies, there is increasing trend for both companies. It might be due to the efficient operations and control of their operating expenditures. Although there is same trend for both companies there is high percentage of operating profit for Mitrajaya Holdings Berhad due to high gross profit.
Return on assets: Return on assets or return on investment measures the effectiveness of the company in using its assets to generate profit. The higher the ratio, the better the status of the company as it indicates the management's efficiency in using its assets to generate profit. The return on assets is very and it has decreasing trend for the Malaysian Resources Corporation Berhad because the company is not efficient in managing assets in generating profit. Although it shows decreased percentage for Mitrajaya Holdings Berhad they are much efficient in managing assets in generating profit.
Return on equity: It measures the efficiency of the company in generating profit for its ordinary shareholders. There is a decreasing trend of return on equity for Malaysian Resources Corporation Berhad which means they are unable to generate more profit for the owners as a result the shareholders will not be happy. Although there is decreased percentage in 2010 for Mitrajaya Holdings Berhad they are efficient in generating profit for the owners.
Earnings per share: It calculates the net profit that is generated from each ordinary share. There is a decreasing trend of earning per share for Malaysian Resources Corporation Berhad which means investors might not want to invest in this company and the existing shareholders might sell their shares in future. Although there is decreased amount in 2010 for Mitrajaya Holdings Berhad there are better amounts of earning per share for the investors.
Leverage ratios; According to the annual reports of MRCB and MHB companies. (2010, 2009, 2008),
Debt ratio: It measures the percentage of total assets that are financed by debts. Creditors prefer lower debt ratio as the lower the debt ratio, the higher the protection for their losses upon liquidation. The Malaysian Resources Corporation Berhad is highly geared company and this is not good for them because there are more assets secured against the loan. The creditor might not be ready to give credit but they can take tax advantage from it. The Mitrajaya Holdings Berhad is low geared company and there is less assets secured against the loan. The creditor will be able to offer credit for them but they can take less tax advantage.
Debt-equity ratio: Debt equity ratio measures the total long-term debts for each ringgit of equity. It indicates that the Malaysian Resources Corporation Berhad is relied on long-term creditor-supplied funds than owner-supplied funds. The Mitrajaya Holdings Berhad is relied more on owner-supplied funds rather than long-term creditor-supplied funds.
Equity multiplier: Equity multiplier shows the asset ownership for each ringgit of equity. The equity multiplier is high in Malaysian Resources Corporation Berhad than Mitrajaya Holdings Berhad which means that the funding of the company's assets via equity is higher for Malaysian Resources Corporation Berhad.
Interest cover ratio: Creditors and other parties would know the company's ability to make interest payments periodically by using the current operation's income. The interest coverage is much better in Mitrajaya Holdings Berhad than Malaysian Resources Corporation Berhad which means they are able to cover the interest expense easily by the income as a result the creditors will be happy invest.
According to the Modigliani–Miller theorem (n.d), in the absence of taxes, bankruptcy costs, and asymmetric information, and in an efficient market, a company’s value will not be affected by how it is financed, regardless of whether the company’s capital consists of equities or debt, or a combination of these, or what the dividend policy is. It is also known as the capital structure irrelevance principle. If there are no taxes, increasing leverage brings no benefits in terms of value creation, but if there are taxes, such benefits, by way of an interest tax shield, accrue when leverage is introduced and/or increased. If both firms are identical in every other way, the value of the two companies is the same.
From the above calculations, it has proven that the highly geared Companies like Malaysian Resources Corporation Berhad are not able to cover interest easy as low geared Companies like Mitrajaya Holdings Berhad. In addition to this, the highly geared company has less earning per share and return on equity compared to low geared company and low geared company is able to generate more profit margins. This means that the highly gearing is not good for the equity shareholders because they get less profit on each share and they will be at risk if the company faces liquidation problem.
Conclusion
The analysis and evaluation of the two companies’ profitability and liquidity ratios show that the Malaysian Resources Corporation Berhad had less profit margins but Mitrajaya Holdings Berhad had high profit margins. In addition to this the Malaysian Resources Corporation was highly geared company compared to Mitrajaya Holdings Berhad. It has been identified that the highly geared company has less profit margins and earnings per share compared to low geared company. Therefore it is advisable to minimize the gearing percentage to avoid problems that may arise in the event of liquidation and to protect equity shareholders profit.
Although ratio analysis is very important tool to judge the company’s performance, there are several problems inherent in attempting to use accounting ratios to assess company performance. Ratios give meaningless figures if the company has generated a loss and there is no absolute definition as to what constitutes a “correct” ratio. They may be calculated almost as one likes, which means that they are capable of manipulation compounding and ratios are often just presented as figures, without any supporting calculations or definitions. Ratio analysis deals only with financial numbers and does not take account of other factors which may affect company performance. If they are calculated over a period of years to provide longitudinal data, then the value of currency in later years will not be the same as that of earlier years, owing to the effect of inflation, etc. In order to get better analysis, industry average and other non financial information are required.
Appendix 1
Workings for MRCB Company;
WORKINGS OF PROFITABILITY AND LEVERAGE RATIO CALCULATIONS
| |||
RATIO AND FORMULA
|
MALAYSIAN RESOURCES CORPORATION BERHAD
| ||
Profitability Ratios
|
2010
|
2009
|
2008
|
Gross profit margin=Gross profit/Sales*100
|
60681000÷344332000× 100= 17.6%
|
63530000÷485459000×100= 13.1%
|
43399000÷459400000× 100= 9.4%
|
Net profit margin=profit after tax/Sales*100
|
39432000÷344332000× 100= 11.4%
|
29695000÷485459000×100= 6.1%
|
50781000÷459400000× 100= 11.1%
|
Operating profit margin=operating profit/Sales*100
|
71975000÷344332000× 100= 20.9%
|
73978000÷485459000×100= 15.2%
|
70394000÷459400000× 100= 15.3%
|
Return on assets=profit after tax/total asset*100
|
39432000÷2292284000× 100= 1.7%
|
29695000÷1703027000× 100= 1.7%
|
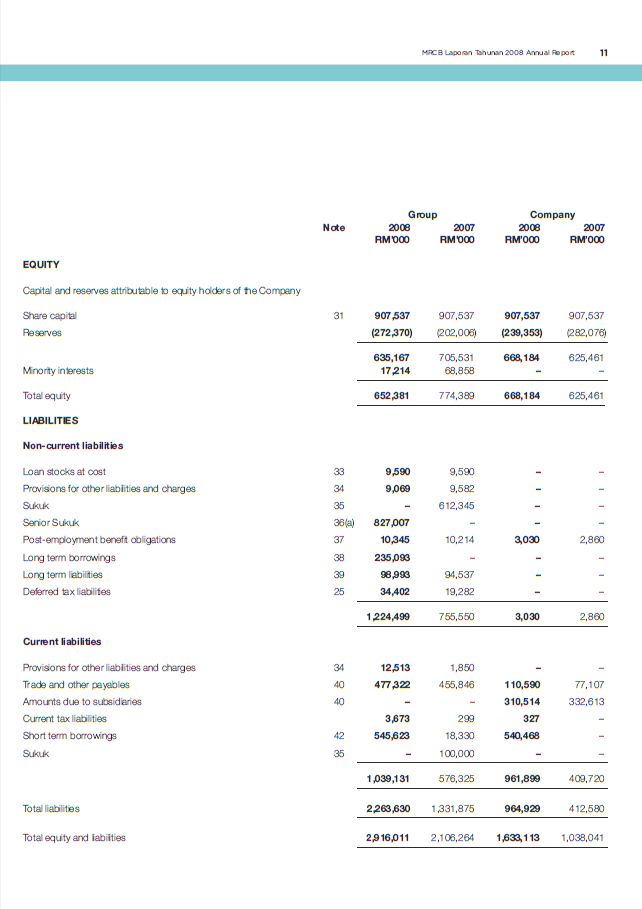
50781000÷1633113000× 100= 3.1%
|
Return on equity=profit after tax/shareholders equity*100
|
39432000÷1257536000× 100= 3.1%
|
29695000÷699993000× 100= 4.2%
|
50781000÷668184000× 100= 7.6%
|
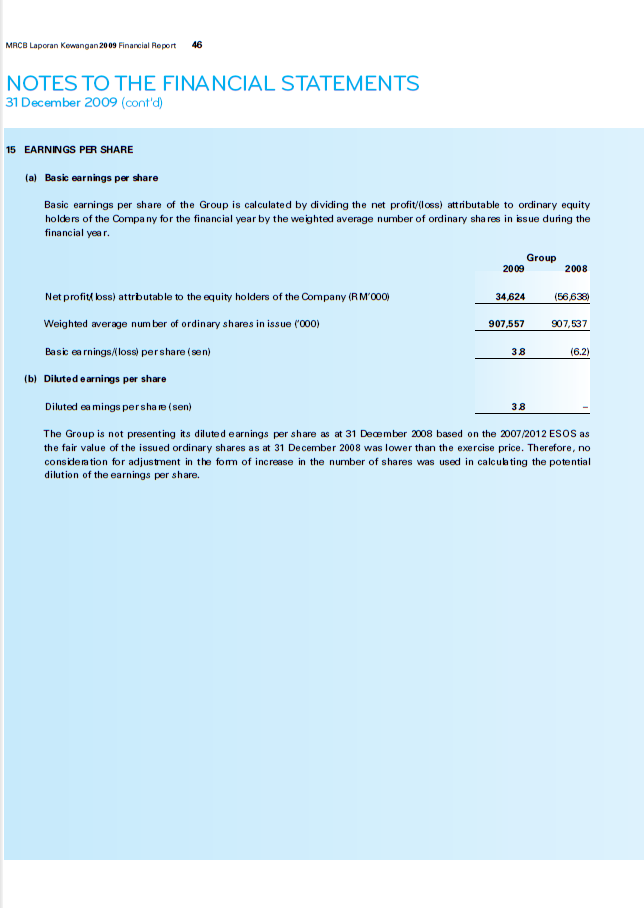
Earnings per share=profit available to ordinary shareholders/no. of ordinary shares issued
|
39432000÷1296145000= 3.04 (Sen)
|
29695000÷907557000= 3.27 (Sen)
|
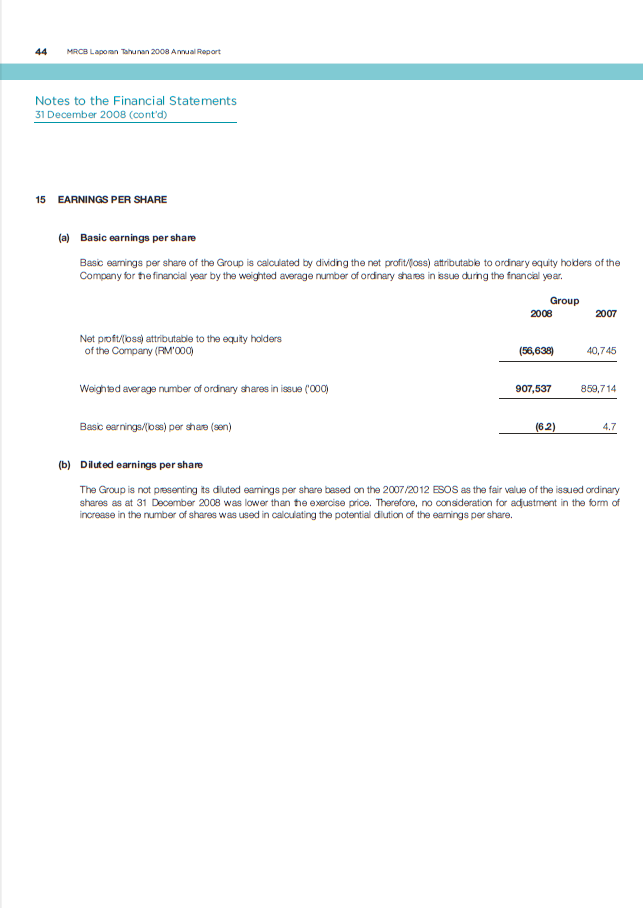
50781000÷907537000= 5.60 (Sen)
|
Leverage Ratios
|
2010
|
2009
|
2008
|
Debt ratio=total liabilities/total assets*100
|
1034748000÷2292284000×100= 45.1%
|
1003034000÷1703027000×100= 58.9%
|
964929000÷1633113000×100= 59.1%
|
Debt-equity ratio=long-term liability/shareholders equity*100
|
502497000÷1257536000×100= 40.0%
|
502365000÷699993000×100= 71.8%
|
3030000÷ 668184000×100= 0.45%
|
Equity Multiplier=total asset/total equity
|
2292284000÷1257536000= 1.8 times
|
1703027000÷699993000= 2.4 times
|
1633113000÷668184000= 2.4 times
|
Interest coverage ratio=profit before interest and tax/ interest expense
|
(48732000+23243000) 71975000÷23243000= 3.1 times
|
(41620000+32358000) 73978000÷32358000= 2.3 times
|
(53305000+17089000) 70394000÷17089000= 4.1 times
|
Appendix 2
Workings for MHB Company;
WORKINGS OF PROFITABILITY AND LEVERAGE RATIO CALCULATIONS
| |||
RATIO AND FORMULA
|
MITRAJAYA HOLDINGS BERHAD
| ||
Profitability Ratios
|
2010
|
2009
|
2008
|
Gross profit margin=Gross profit/Sales*100
|
8687500÷ 8687500× 100= 100%
|
30000000÷30000000×100= 100%
|
4000000÷ 4000000× 100= 100%
|
Net profit margin=profit after tax/Sales*100
|
8794831÷ 8687500× 100= 101.2%
|
30295389÷30000000×100= 101%
|
3733987÷ 4000000× 100= 93.3%
|
Operating profit margin=operating profit/Sales*100
|
9692046÷ 8687500× 100= 111.6%
|
30997314÷30000000×100= 103.3%
|
4309108÷ 4000000× 100= 107.7%
|
Return on assets=profit after tax/total asset*100
|
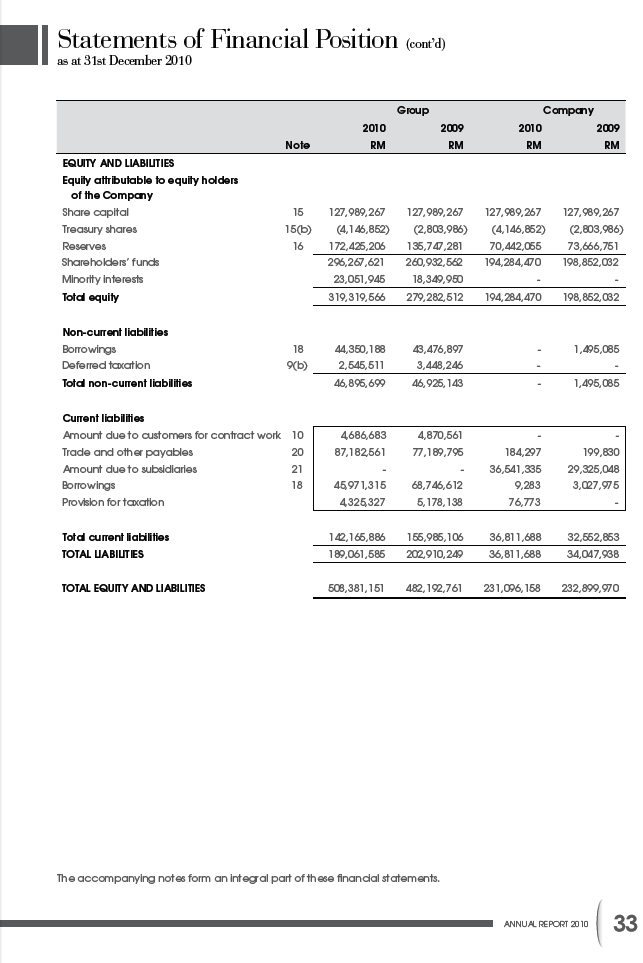
8794831÷231096158× 100= 3.8%
|
30295389÷232899970× 100= 13%
|
4733987÷189836668× 100= 2.5%
|
Return on equity=profit after tax/shareholders equity*100
|
8794831÷194284470× 100= 4.5%
|
30295389÷198852032× 100= 15.2%
|
4733987÷170577039× 100= 2.8%
|
Earnings per share=profit available to ordinary shareholders/no. of ordinary shares issued
|
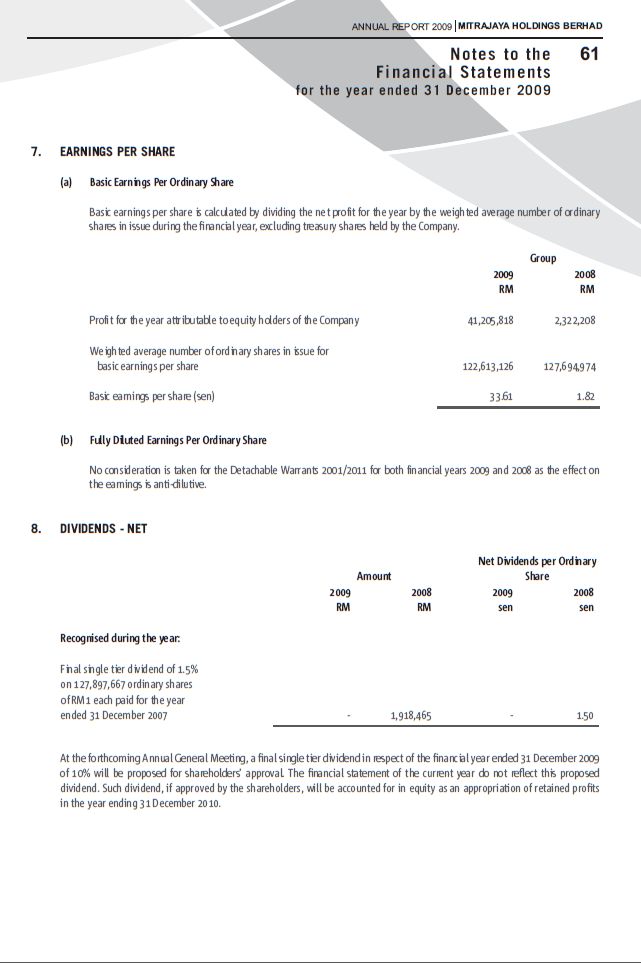
8794831÷120398975= 7.30 (Sen)
|
30295389÷122613126= 24.71 (Sen)
|
4733987÷127694974= 2.92 (Sen)
|
Leverage Ratios
|
2010
|
2009
|
2008
|
Debt ratio=total liabilities/total assets*100
|
36811688÷231096158×100= 15.9%
|
34047938÷232899970×100= 14.6%
|
19259629÷189836668×100= 10.1%
|
Debt-equity ratio=long-term liability/shareholders equity*100
|
0÷194284470×100= 0%
|
1495085÷198852032×100= 0.75%
|
10758599÷170577039×100= 6.3%
|
Equity Multiplier=total asset/total equity
|
231096158÷194284470= 1.2 times
|
232899970÷198852032= 1.2 times
|
189836668÷170577039= 1.1 times
|
Interest coverage ratio=profit before interest and tax/ interest expense
|
9692046÷44035= 220 times
|
30997314÷555873= 55.8 times
|
4309108÷1157367= 3.7 times
|
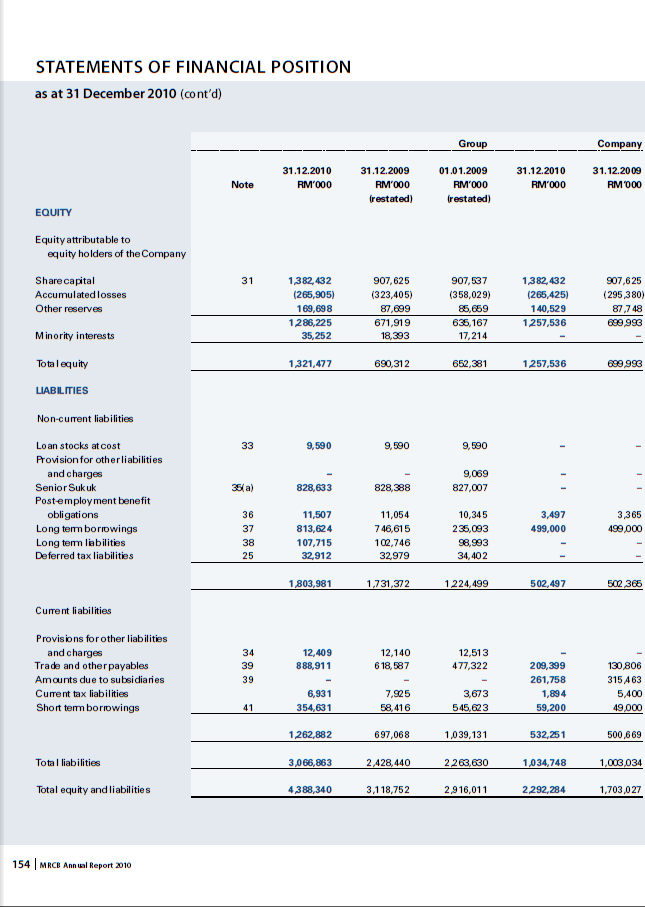
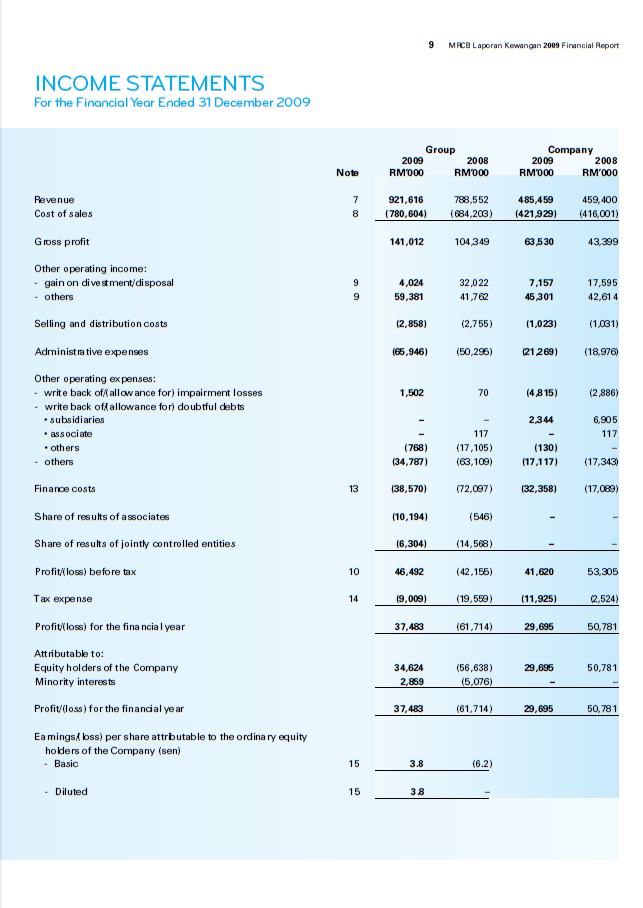
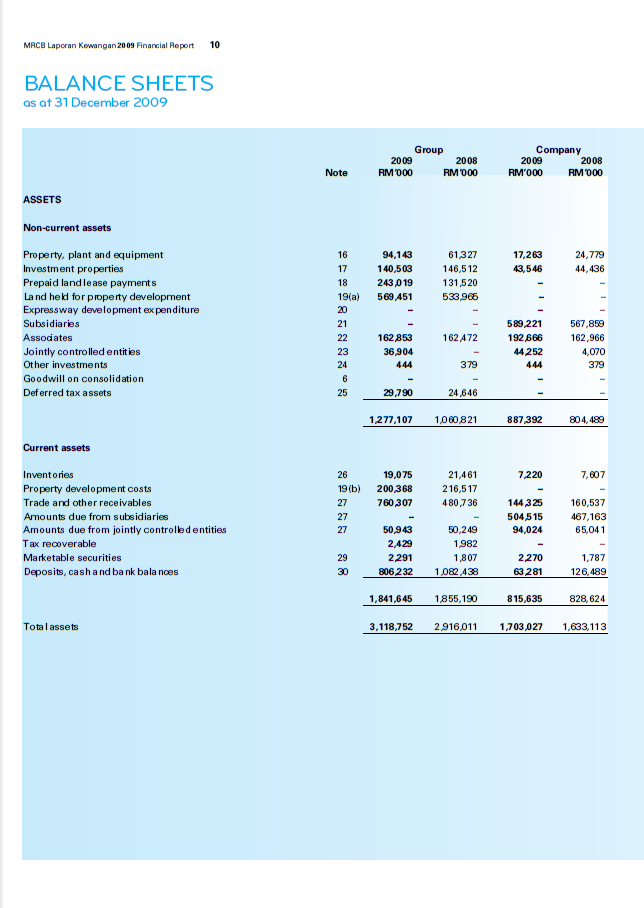
Appendix 3: Annual accounts of MRCB Company


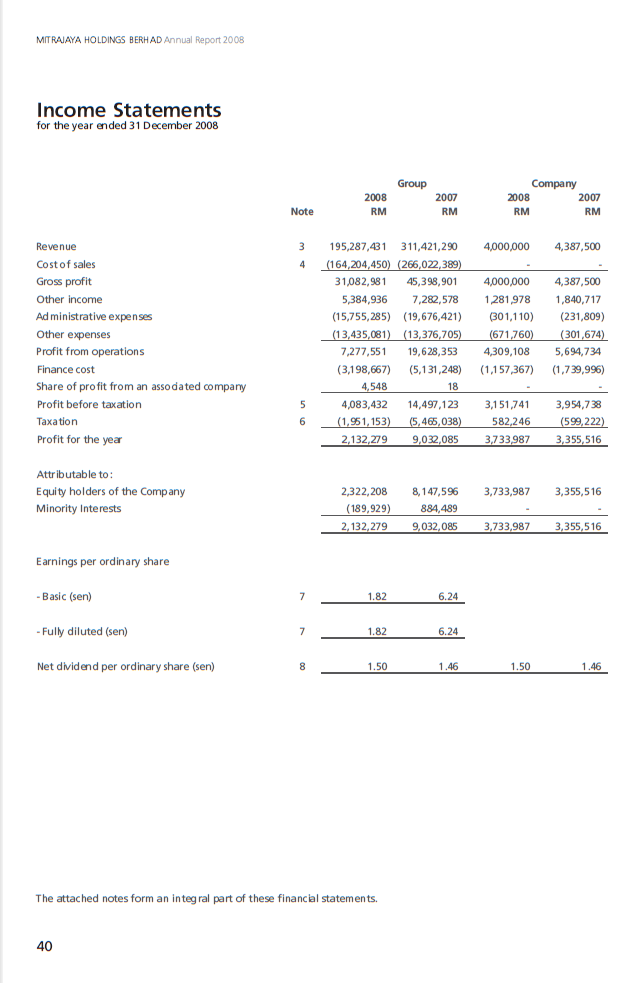
Appendix 4: Annual accounts of MHB Company


References
About MRCB. (n.d). Retrieved March 02, 2012, from http://www.mrcb.com.my/main/index.php
Dr. Ibrahim, Y., Abidin, F, Z., Manab, N, A., Ismail, R., Zainuddin, Z. (2010, p.19-78). Financial Management I. Meteor Doc.Sdn.Bhd: Malaysia.
Dr. Jane, F. H., Mike, S., Jo, P. (n.d). Inherent limitations in using financial ratio analysis to assess small and medium sized company performance. Retrieved March 02, 2012, from http://docs.google.com/viewer?a=v&q=cache:RxcAPtIXq4QJ:www.sheffield.ac.uk/content/1/c6/06/89/64/2007-01.pdf+limitation+of+ratio+analysis&hl=en&gl=mv&pid=bl&srcid=ADGEESgzzLen1LEdvtdhyV-quz1ZWLzs41A2Hb78Mgofh_9WuwKu7I0pid9mBnkbEJO3oHFy-qqLLlCjOqd_JL-JhVQk6G_93qEcLWxCe7uBS3-_BvMoBKW8dmuiZlxaq2QG1m4D0lD6&sig=AHIEtbQ2pKti6Ugc9g8QNiqib20Y_Nho7A
Mitrajaya Holdings Berhad. (2010). Annual Report. Retrieved March 02, 2012, from http://www.bursamalaysia.com/website/bm/listed_companies/company_announcements/annual_reports/index.jsp
Mitrajaya Holdings Berhad. (2009). Annual Report. Retrieved March 02, 2012, from http://www.bursamalaysia.com/website/bm/listed_companies/company_announcements/annual_reports/index.jsp
Mitrajaya Holdings Berhad. (2008). Annual Report. Retrieved March 02, 2012, from http://www.bursamalaysia.com/website/bm/listed_companies/company_announcements/annual_reports/index.jsp
Malaysian Resources Corporation Berhad. (2010). Annual Report. Retrieved March 02, 2012, from http://www.bursamalaysia.com/website/bm/listed_companies/company_announcements/annual_reports/index.jsp
Malaysian Resources Corporation Berhad. (2009). Annual Report. Retrieved March 02, 2012, from http://www.bursamalaysia.com/website/bm/listed_companies/company_announcements/annual_reports/index.jsp
Malaysian Resources Corporation Berhad. (2008). Annual Report. Retrieved March 02, 2012, from http://www.bursamalaysia.com/website/bm/listed_companies/company_announcements/annual_reports/index.jsp
Our business portfolio. (n.d). Retrieved March 02, 2012, from http://www.mitrajaya.com.my/bizportfolio.html
Understanding Capital Structure Theory: Modigliani and Miller. (n.d). Retrieved March 02, 2012, from http://www.qfinance.com/contentFiles/QF02/g1xqynvv/12/0/understanding-capital-structure-theory-modigliani-and-miller.pdf
thanks for info bro...
ReplyDelete